we explain consumer markets
See where your customers really shop
Every card payment records what a household really bought, where and when, including at your competitors. Iceflower turns those payments into answers for every team: who you compete with, who is taking your customers, and where your next revenue is.
No credit card required.
Built on real transactions from a panel of 130 million+ US and EU consumers.
Real questions, answered from the panel
Where else do Chipotle's customers eat?
-
McDonald's
$259 a year
86.7%
-
Chick-fil-A
$205 a year
74.8%
-
Taco Bell
$120 a year
61.1%
-
Wendy's
$90 a year
59.6%
Nearly 9 in 10 also eat at McDonald's, and spend $259 a year there.
Share of 4.4M Chipotle buyers on the panel, Sep 2025 to Aug 2026
Which other insurers do GEICO customers pay?
-
progressive.com
$1,303 a year
12.4%
-
statefarm.com
$1,321 a year
5.6%
-
allstate.com
$1,407 a year
3.9%
-
usaa.com
$888 a year
3.5%
One in eight GEICO customers also pays Progressive, $1,303 a year on average.
Share of 1.27M geico.com payers on the panel, Sep 2025 to Aug 2026
Who wins Arizona's coffee run, store for store?
-
Dutch Bros Coffee
94 stores
$18.1M
-
Starbucks
596 stores
$17.4M
-
Black Rock Coffee Bar
42 stores
$7.2M
Dutch Bros takes more card spend in Arizona than Starbucks, from a sixth as many stores.
Panel card spend at mapped Arizona stores, Sep 2025 to Aug 2026
Do first-time Trader Joe's shoppers come back?
100% at first visit
20.6%
next month
17.7%
two years on
One in five is back the next month, and the line barely moves after that.
631k first-time shoppers from Apr to Jul 2024, share active each month since
Who lives in Austin, and what sets them apart?
-
Early adopters
212
-
Affluent & luxury
200
-
Foodies
178
-
Health & wellness
168
Austin households spend twice the panel average on early-adopter and luxury buys.
36,716 panel households homed in Austin, TX. Index 100 = panel average
the raw material
Every answer stands on a real transaction
Surveys hear what people say. Foot traffic sees where phones went. Loyalty data sees only your own customers. Transactions show what every household actually spent, with you and with everyone else, in store and online.
A raw transaction string
CONSUMER DEBIT WAL WAL-MART SUPER XXXXXX 2242 WAL-SAMS AN Date 09/26/24 4 XXXXXXXXXX 8 5411 Card 12 #4213
A named merchant and store
| Merchant | Walmart · Supercenter |
|---|---|
| Store | #2242, 440 N Euclid St, Anaheim, CA |
| Date | Sep 26, 2024 |
| Category | Groceries |
A market explained
Who else earns this household’s grocery spend - and how far do they travel for it?
Iceflower resolves raw card and bank transaction strings into named merchants, stores and markets. That resolution layer is the ground truth under every chart, map and report - and it reaches you wherever you work.
Dashboard
The interactive workspace in the browser. Benchmarks, maps, cross-shopping and reports for your team.
Bespoke reports
A scoped question, answered as a report or a live workspace.
Data feed
The same resolved data, delivered by API or scheduled feed straight into your warehouse, models and BI tools.
MCP
An MCP server your AI agents connect to - answers in Claude or your own copilot, grounded in real transactions.
every team
One dataset, every team’s question
Transactions record what people actually did, so the same panel answers the strategy team on Monday and the real estate team on Tuesday, without commissioning a new study each time.
Strategy & insights
-
“How big is our category in this market, and who is gaining share?”
Answered in Category benchmarks
-
“Which competitor is winning the customers we lose?”
Answered in Revenue flow
-
“Is our growth coming from more customers or from bigger baskets?”
Answered in Merchant benchmarks
Real estate & expansion
-
“Where do our stores actually draw their customers from?”
Answered in Catchments
-
“Where does our category's spend concentrate, and where are we missing?”
Answered in Explore map
-
“Which cities are households moving to, and where from?”
Answered in Customer movement
Marketing & CRM
-
“Who are our best customers, and how much of their wallet do we get?”
Answered in Customer value
-
“Where did our lapsed customers take their spend?”
Answered in Revenue flow
-
“Which brands share our customers and would make good partners?”
Answered in Cross-shopping
Shopping centres & landlords
-
“Which tenants bring the most customers to our centre?”
Answered in Malls & places
-
“How does our centre compare with the one down the road?”
Answered in Malls & places
-
“Which fast-growing brands nearby should we bring in next?”
Answered in Bespoke reports
Product & research
-
“Who is the household behind a typical basket?”
Answered in AI personas
-
“What would bring lapsed buyers back?”
Answered in AI questionnaires
-
“How would our buyers react to a new price or format?”
Answered in AI questionnaires
Data & AI teams
-
“Which merchant, store and category is behind each raw card string?”
Answered in Data feed
-
“What does the whole market look like in our own BI tools?”
Answered in Data feed
-
“Can our copilot answer market questions with real numbers?”
Answered in MCP server
Your question is not on the list? Bring it to a scoping call.
understand
What is really happening in my market?
Market, category and merchant benchmarks
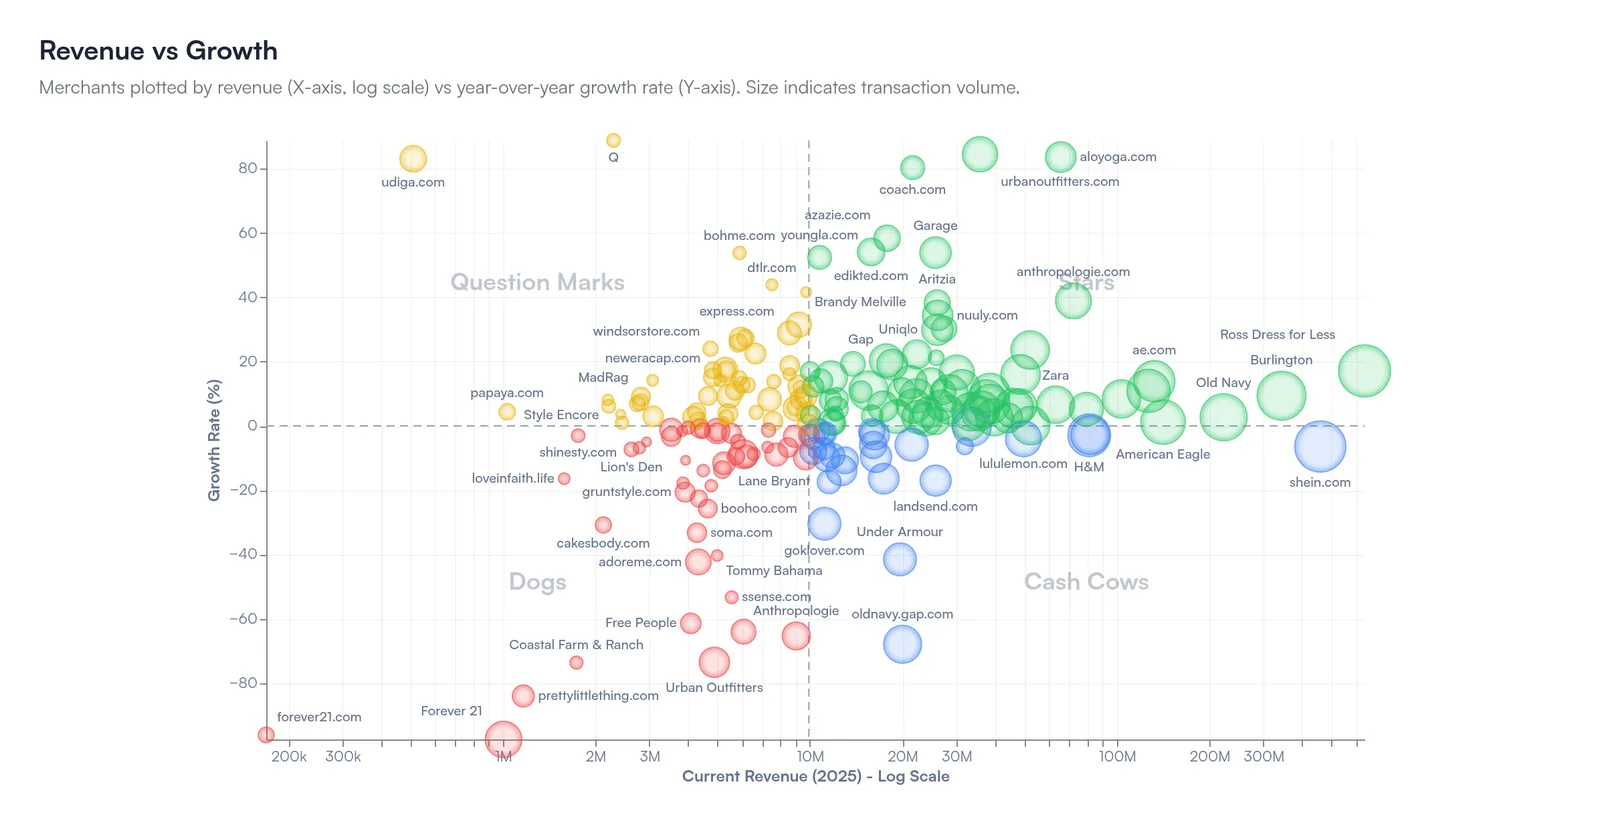
Plot every merchant in a category by revenue and growth at location level - see who is a star and who is fading, and how your brand ranks against all of them, from national chains to the local challenger.
Geo analysis & catchments
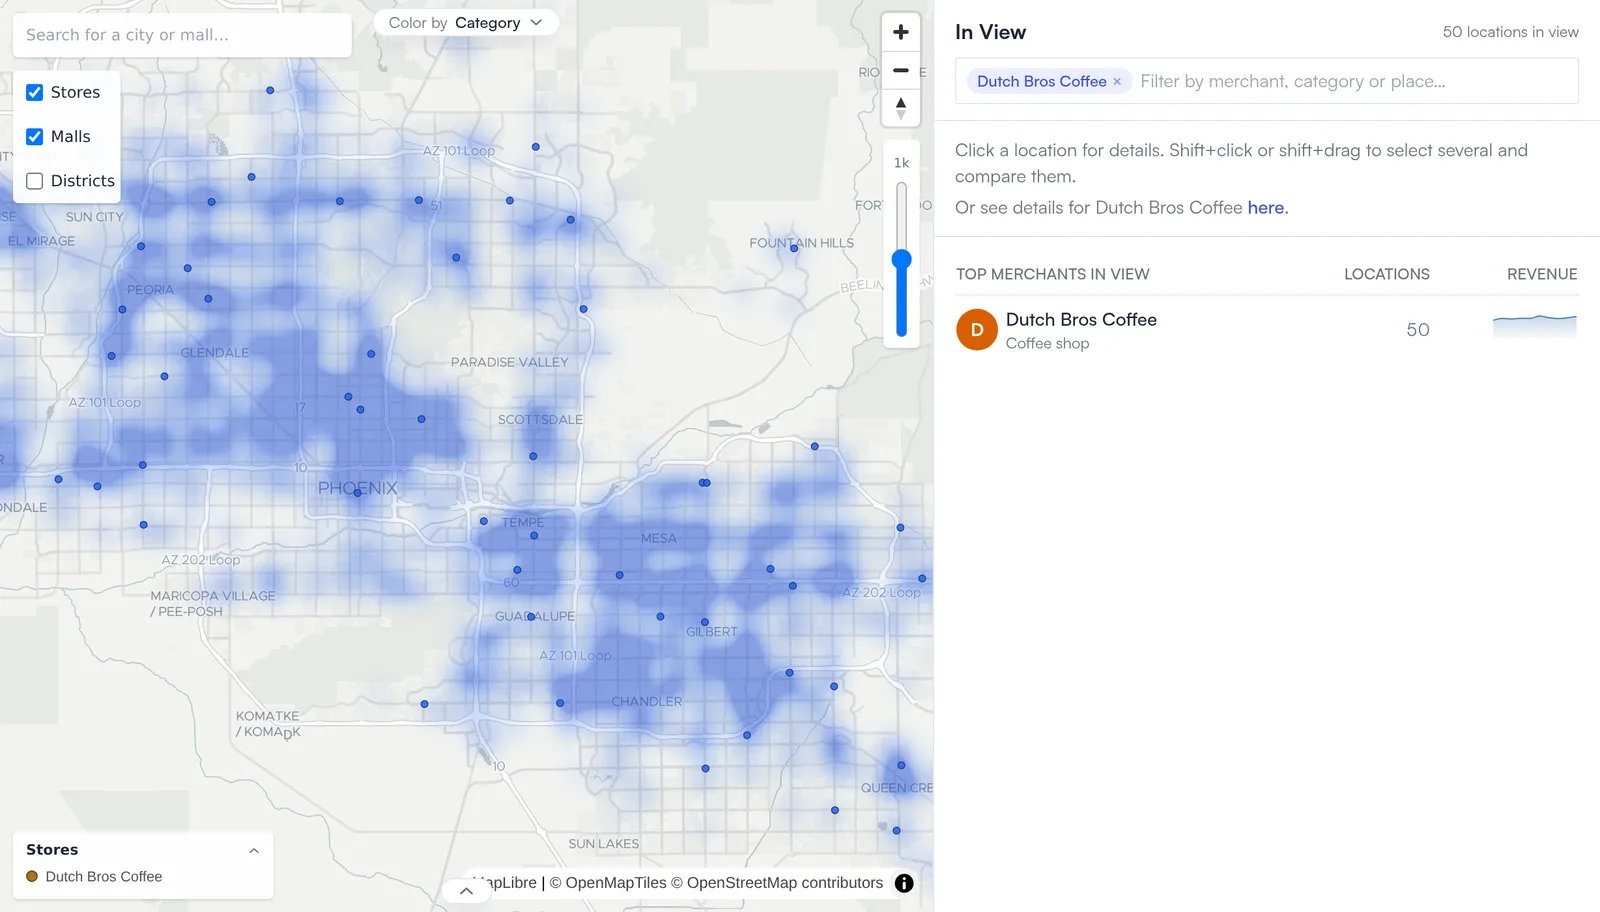
Store catchments, customer overlap and loyalty flows built from where customers actually live and spend - for your stores and every competitor around them.
Malls & places
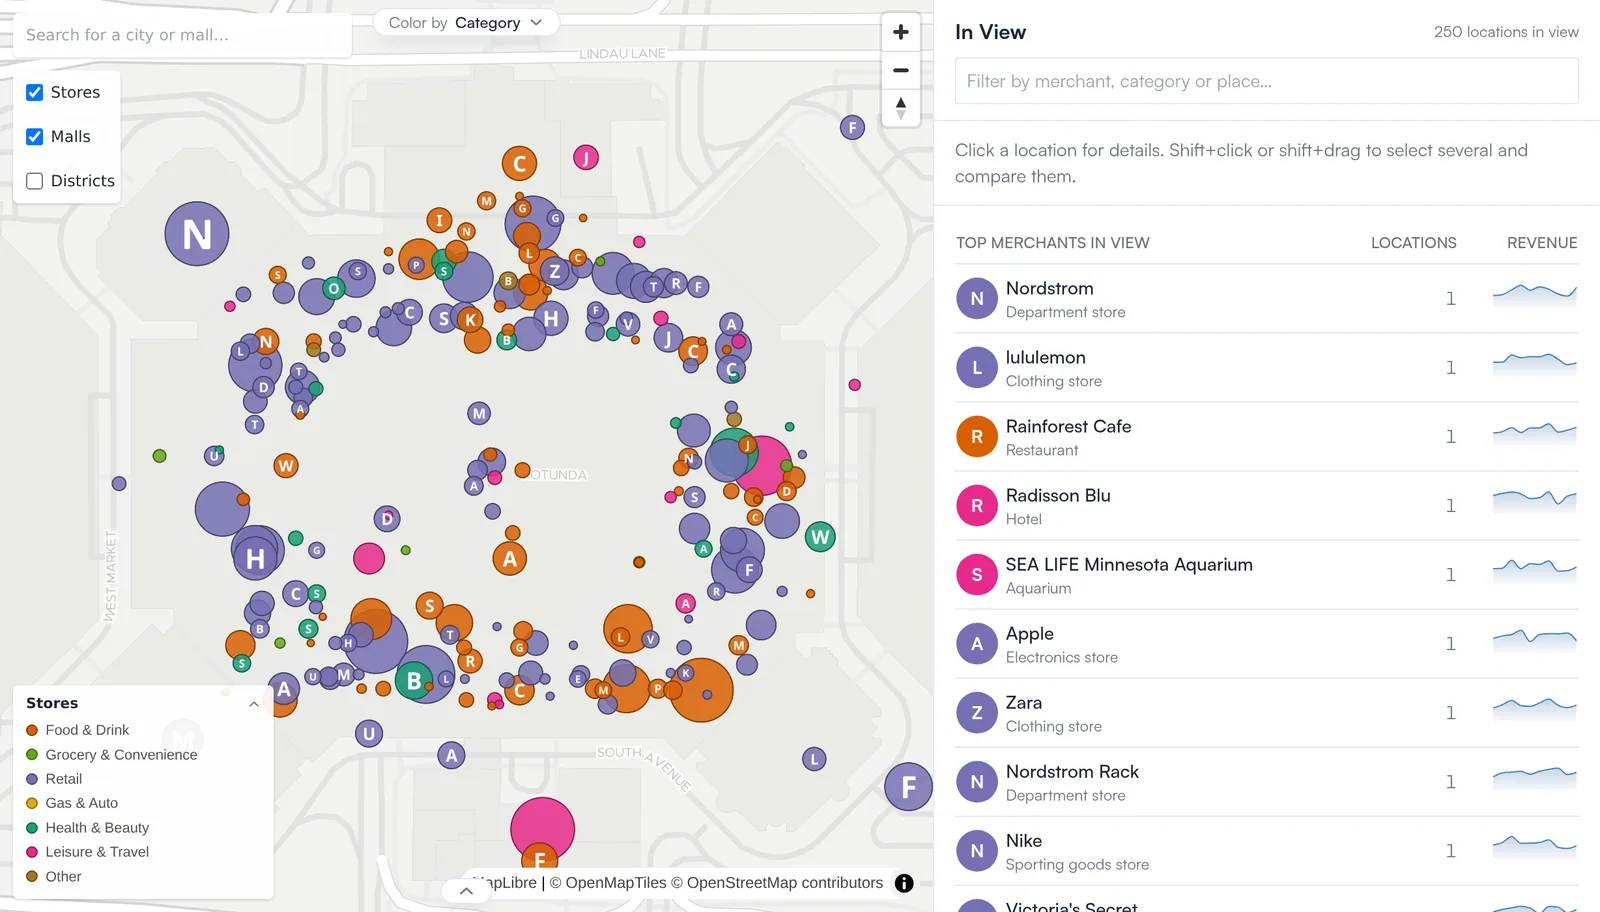
Every mall and retail place with its stores, transactions, customers and revenue - down to the individual store.
Sample question we answer
“How big is our category, who is gaining, and where do our stores actually draw from?”
defend
Who is taking my customers?
Watch revenue switch hands
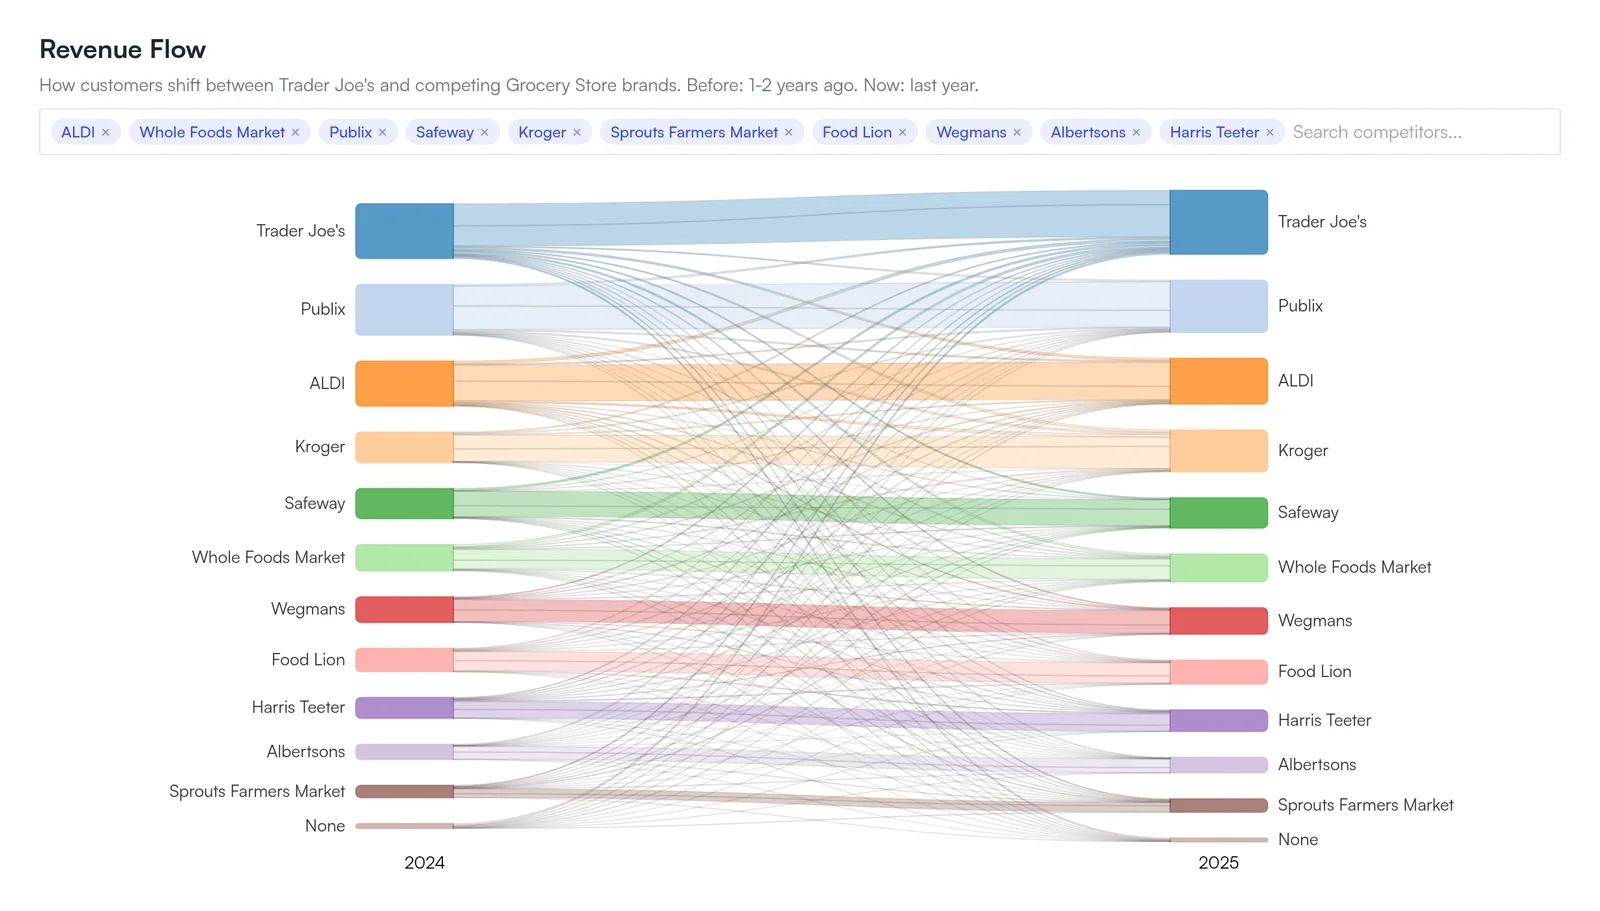
Follow customers from brand to brand, location to location or online, year over year - who they left, where they went, and which competitor is winning the wallet you used to own.
Cross-shopping
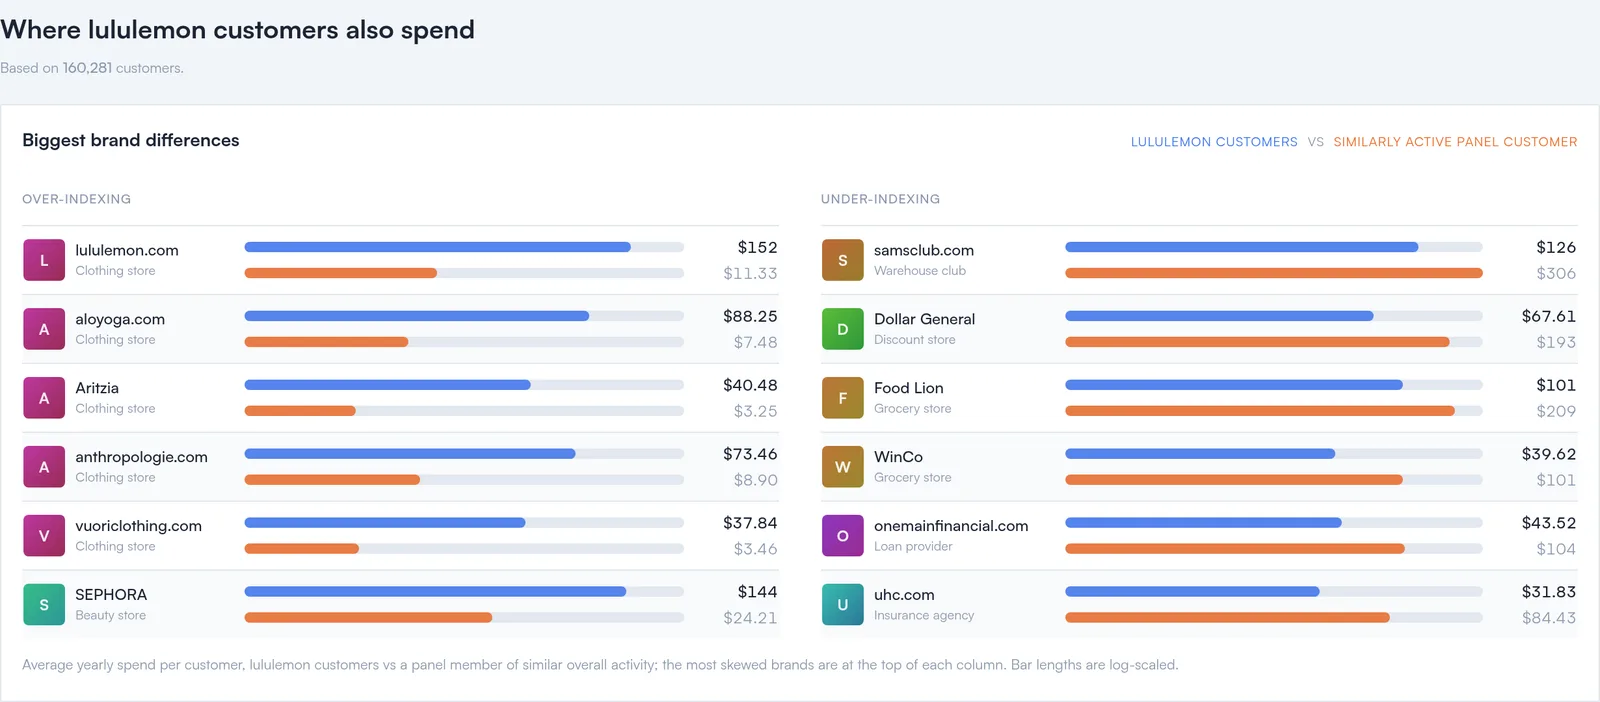
See where your customers also spend - overlap, share of wallet, and the competitors quietly taking share.
Customer value & retention
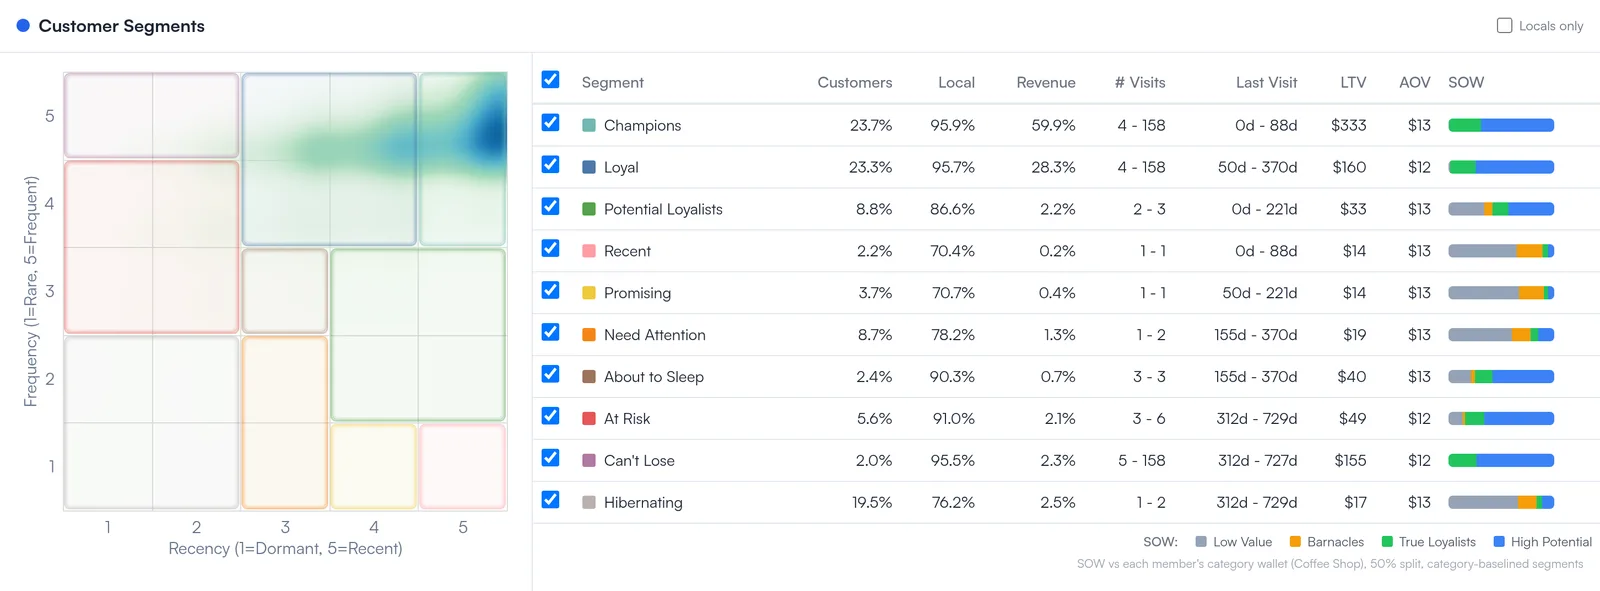
See which customers carry the business and which are slipping: retention curves, lifetime value, and behavioural segments.
Sample question we answer
“Which competitor gained the most from our lapsed customers last year, and which segment is slipping right now?”
grow
Where is my next revenue?
Customer movement
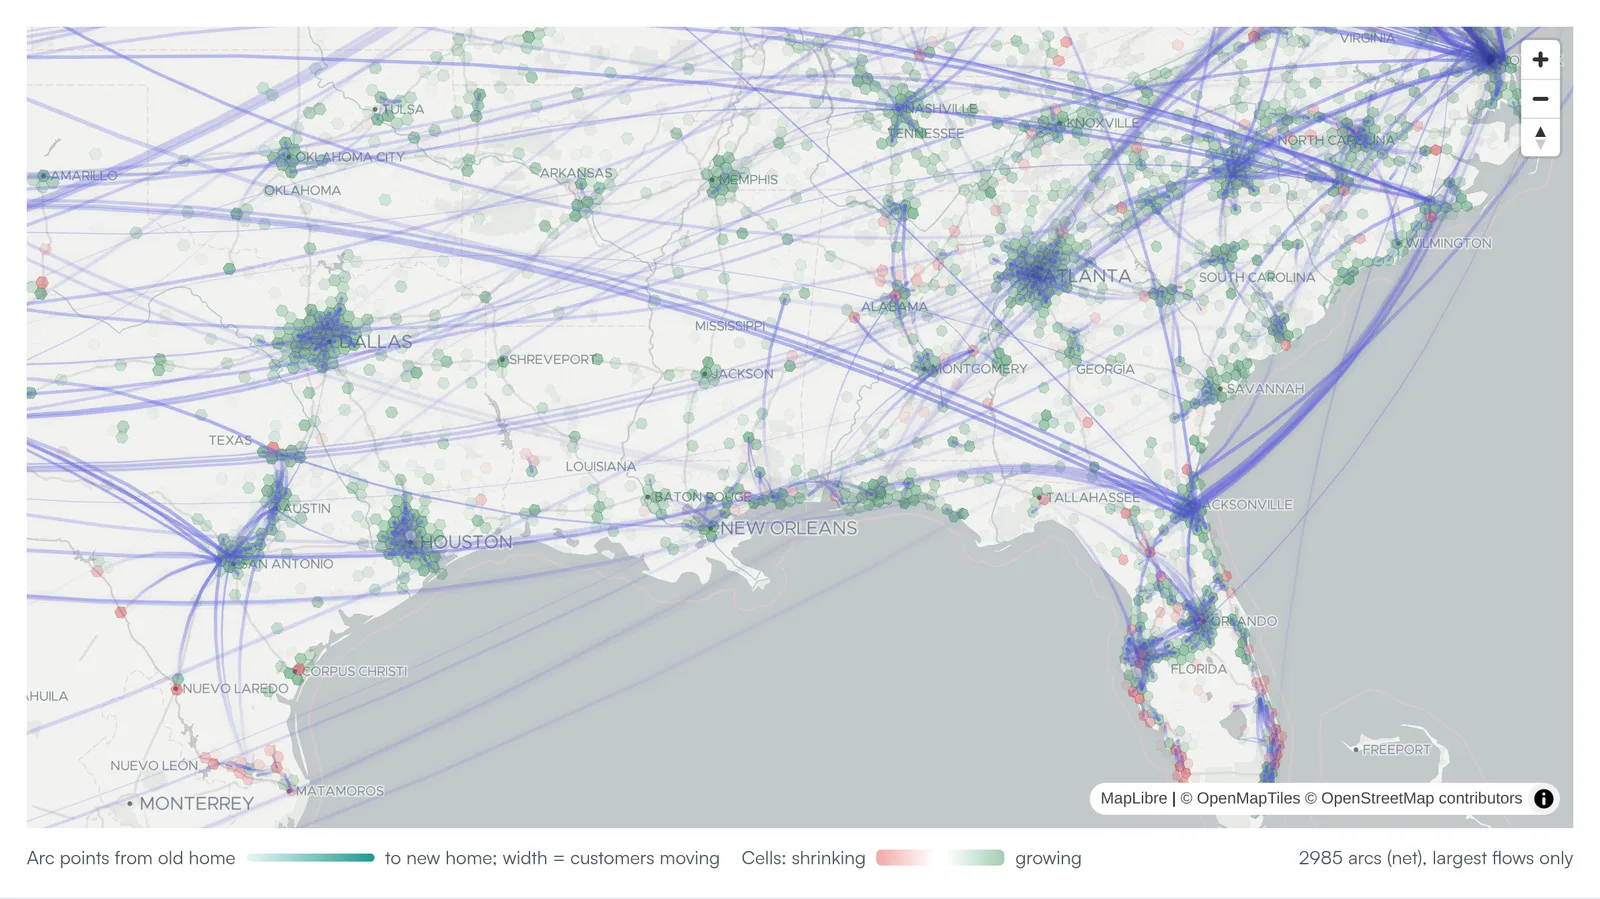
Demand moves. Spot opportunities before your competitors do - follow households as they relocate, and watch spending shift between cities and markets.
AI personas & questionnaires
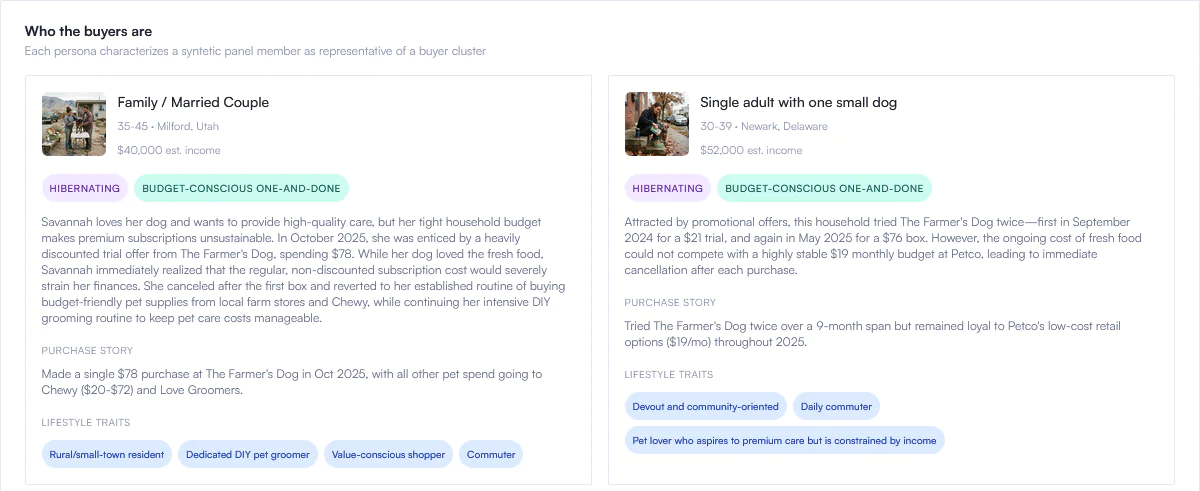
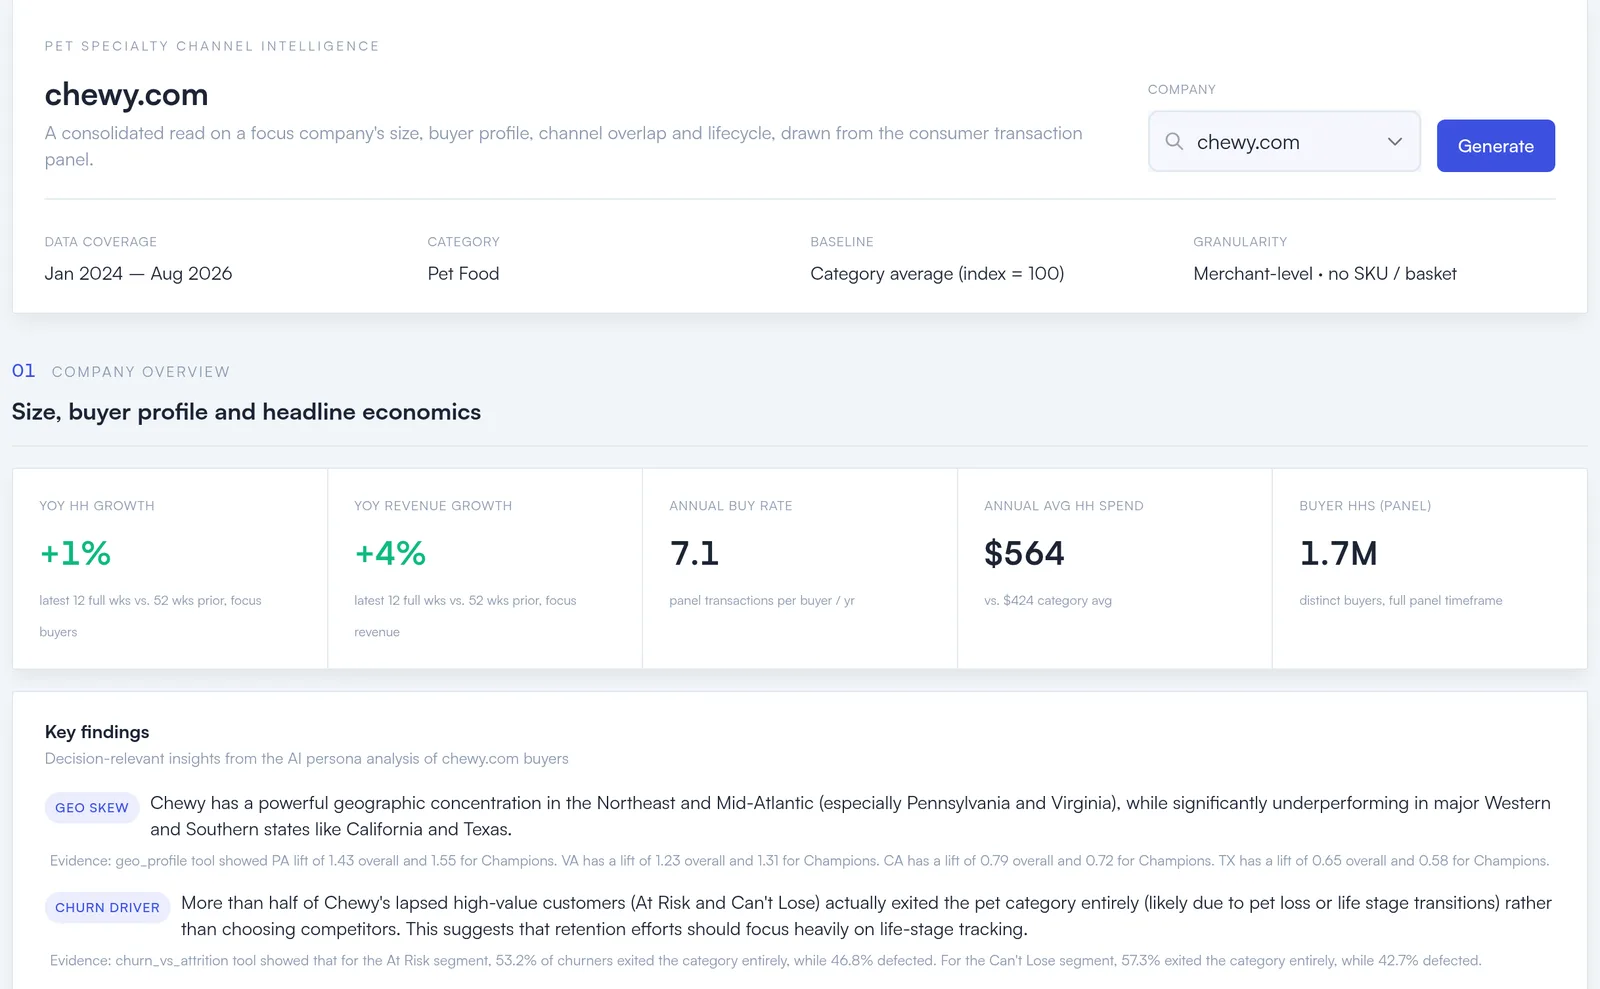
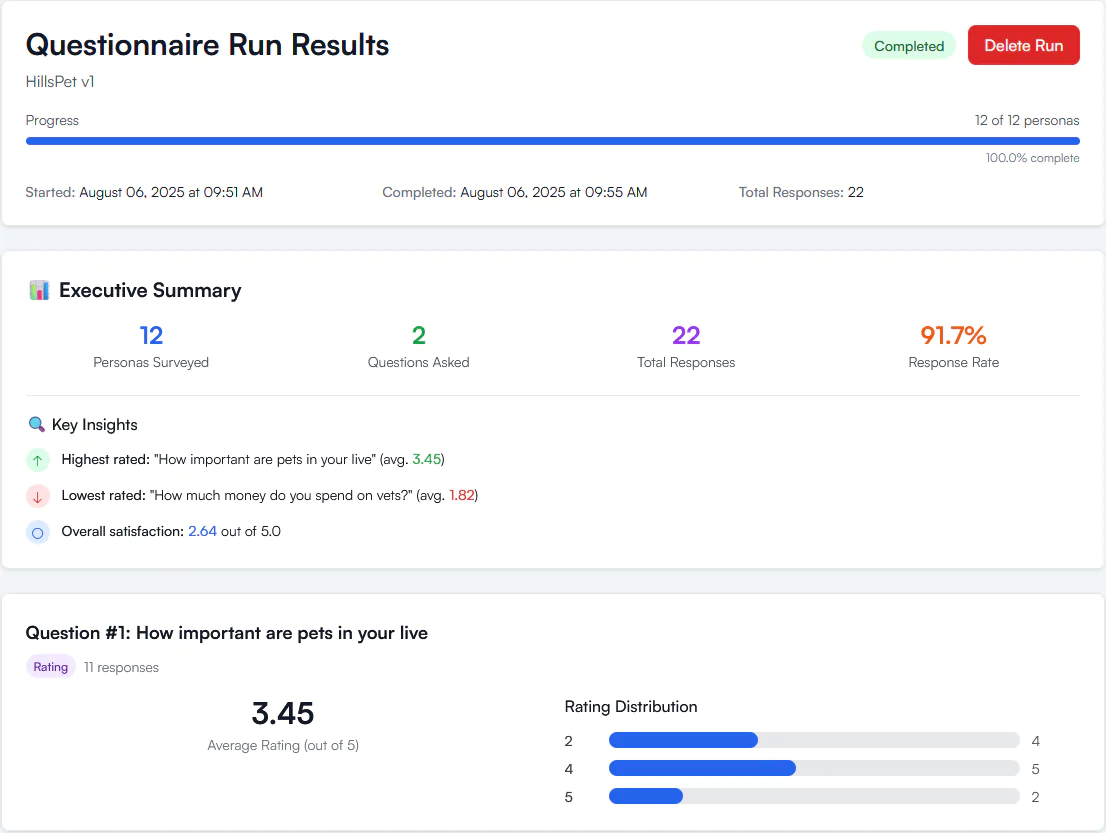
Chat with AI personas built from real purchasing behaviour, or send your market a questionnaire and read the results in the morning - before you spend a cent on new stores or campaigns.
Sample question we answer
“Which three metros should get our next stores, and what would bring lapsed buyers back?”
Every question above, answered in minutes, not weeks
Describe what you want to know and Iceflower’s AI analyst assembles the charts, numbers and narrative for you - grounded in the same real transactions that power every view on this page.
pricing
Straight prices, no surprises
Explore
One market, in full depth.
- For a single team
- One category in one US state, UK region or metro area
- AI / MCP agent access
- 14-day free trial
Professional
The nationwide market picture.
- For your whole organization
- Everything in Explore
- Up to three categories, up to a whole country
- AI personas, chats & questionnaires
- AI reports
- 14-day free trial
Enterprise
Full access, built around you.
- For your company and its systems
- Everything in Professional
- API and data feeds
- Your own live bespoke workspace, updated continuously
- Malls & places analytics
Prices exclude taxes. Trials do not require a credit card.
faq
Frequently asked questions
- What data is Iceflower built on?
- Real card and bank transactions from a panel of more than 130 million US and EU consumers. Merchant benchmarks, cross-shopping, catchment maps and customer movement are all computed from actual purchases, not surveys or modeled estimates.
- Is there a free trial?
- Yes. The Explore and Professional plans include a 14-day free trial. No credit card is required.
- How is Iceflower priced?
- Explore is $990 per month, Professional is $2,900 per month, both billed monthly and cancelable anytime, and Enterprise is priced individually - talk to us. Prices exclude taxes.
- What is the difference between the plans?
- Explore gives a single team one category in one US state, UK region or metro area, in full depth. Professional covers up to three categories, up to a whole country, for your entire organization, and adds AI personas, chats, questionnaires and AI reports. Enterprise adds API and data feeds, malls and places analytics, and a bespoke workspace that is updated continuously. AI / MCP agent access is included in every plan.
- Which markets does Iceflower cover?
- The transaction panel spans the United States and the European Union. Self-serve plans cover the United States and the United Kingdom: an Explore plan is scoped to one state, region or metro area, Professional up to a whole country, and Enterprise coverage is built around you.
- Can we bring you a specific question?
- Yes - that is how most teams start. Book a scoping call, bring the question you are trying to answer, and we will show you how Iceflower answers it for your market.
Ready to see your market clearly?
Create an account, pick a plan, and explore your merchants, competitors and customers the way they actually behave.